to leave a comment.
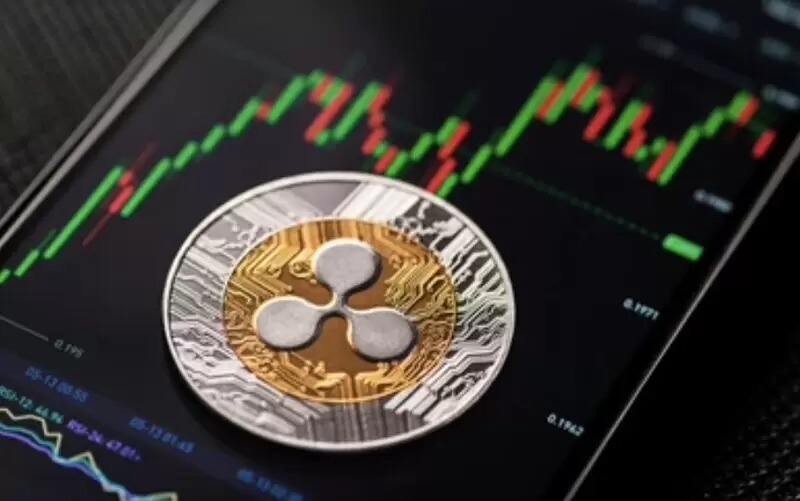
▲ Photo: XRP
XRP is attempting a rebound in July. However, if the Fibonacci 1.0 retracement line, which has supported the entire bull market, breaks down, it stands at a critical juncture where it could fall below $1.
According to crypto media outlet The Crypto Basic on July 3 (local time), XRP started around $1.05 in the second week of November 2024 and rose to an all-time high of $3.66 in July 2025. However, over the subsequent 11 months, it gradually gave back its gains and is currently hovering just above the Fibonacci 1.0 retracement line of $1.00795, around $1.1.
At the end of June, XRP fell to $1.009, testing the $1 mark most strongly since November 2024. $1.00795 is the price point that has retraced to the starting point of this upward cycle, and its defense based on the weekly closing price has been presented as a key variable for maintaining the bullish structure.
During the 11-month decline since August 2025, XRP successively gave up the Fibonacci 0.382 retracement line at $2.65117, the 0.618 retracement line at $2.02366, the 0.786 retracement line at $1.57696, and the 0.888 retracement line at $1.30575. These zones have now turned into resistance levels, and if it falls below $1.00795, the $0.8-$0.9 range is mentioned as a short-term defense line.
The downtrend is still pressuring the price. XRP recently rose to a weekly high of $1.11 but slightly receded to $1.09969, failing to decisively break above the downtrend line that began from its July 2025 peak. According to the Ichimoku Kinko Hyo, the conversion line is at $1.27885 and the base line is at $1.71205, indicating that the rebound has not yet confirmed a trend reversal.
The first weekly candle in July started at $1.04646 and rose to $1.11, showing a 5.07% increase. XRP spot ETF inflows also recorded positive figures for 8 consecutive weeks, with weekly inflows on June 26 totaling $22.99 million and cumulative net inflows reaching $1.47 billion. Exchange outflows also increased by approximately 200%, rising from 40.7 million XRP on June 22 to about 123 million XRP afterward.
For XRP to continue its recovery, it must first overcome the Fibonacci 0.888 retracement line at $1.30575 and the conversion line at $1.27885. After that, the Fibonacci 0.786 retracement line at $1.57696 is presented as the next hurdle. However, the current price is below all of the 20-day exponential moving average at $1.11, the 50-day exponential moving average at $1.20, the 100-day exponential moving average at $1.31, and the 200-day exponential moving average at $1.52, meaning it needs to break through several resistance levels for sustained recovery confirmation.
[Article Key Summary]
-XRP is testing whether it can maintain its bullish structure above the Fibonacci 1.0 retracement line at $1.00795.
-After reaching an all-time high of $3.66 in July 2025, it has declined for 11 months, successively giving up key Fibonacci support levels.
-XRP spot ETFs have recorded fund inflows for 8 consecutive weeks, but the price remains below key moving averages, facing recovery pressure.
*Disclaimer: This article is for investment reference only, and we are not responsible for any investment losses based on it. The content should be interpreted for informational purposes only.*
Newsletter
Get key news delivered to your email every morning
to leave a comment.