to leave a comment.
▲ XRP/AI-generated image ©
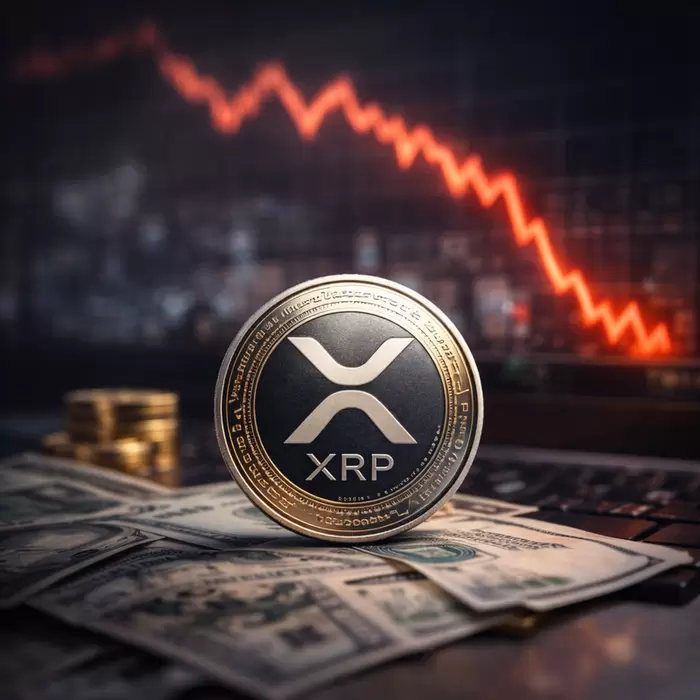
As the cryptocurrency market, which recently hit a high, undergoes a general correction, XRP (Ripple) is also testing the $1.40 support level and facing the risk of further decline. However, despite the technical weakness, funds are steadily flowing into spot exchange-traded funds and the derivatives market, indicating that investors' medium-to-long-term confidence remains strong.
According to investment media FXStreet on May 7 (local time), XRP retreated from its weekly high of $1.46 recorded the previous day, falling to around the current short-term support level of $1.40. This decline aligns with the overall trend of the virtual asset market, as the leading cryptocurrency Bitcoin (BTC) broke its 3-month high of $82,850 and then retested the $80,000 support level.
Despite the price decline, market participants' buying sentiment remains unbroken. According to SosoValue data, the net inflow into US-listed XRP spot exchange-traded funds has been increasing daily: $3.87 million on Monday, $11.28 million on Tuesday, and $13.03 million on Wednesday. Consequently, the cumulative inflow reached an average of $1.32 billion, and net assets under management totaled $1.11 billion. Furthermore, the Crypto Fear & Greed Index slightly rose from 46 to 47 the previous day, maintaining positive investor sentiment.
The derivatives market is also showing a gradual recovery. The open interest in XRP futures increased from $2.59 billion the previous day to $2.61 billion. However, the media pointed out that the current retail investor demand is significantly lower than the peak open interest of $10.94 billion recorded last July when XRP hit an all-time high of $3.66. It emphasized that for a solid long-term bullish outlook to be established, an explosive increase in open interest must accompany a price surge.
Technical indicators show a neutral to slightly positive bias in the short term. XRP is currently hovering above the 50-day exponential moving average of $1.41, which acts as an initial trend support, but remains below the 100-day and 200-day exponential moving averages of $1.50 and $1.74, respectively. The Relative Strength Index on the daily chart is balancing around 52, and the Moving Average Convergence Divergence (MACD) histogram has slightly risen above the 0 line, suggesting a limited recovery in buying pressure.
Experts identified the area around $1.45, where previous rallies struggled, as the first resistance level for a future ascent. If this is surpassed, $1.50 and $1.74, which forms a long-term bearish structure, are expected to act as the next resistances. Conversely, on the downside, the key is whether the short-term support of $1.41 can be defended. A clear breakdown of this level on a daily closing basis could lead to a deeper decline, accompanied by a weakening of technical momentum.
*Disclaimer: This article is for investment reference only, and we are not responsible for any investment losses based on it. The content should be interpreted for informational purposes only.*
Newsletter
Get key news delivered to your email every morning
to leave a comment.